A Pharmacist’s Perspective along the Quality Improvement Journey
Marie Anne Louis-Jeune, PharmD, BCPS
Pharmacy Safety & Quality Coordinator
Memorial Cancer Institute
Hollywood, Florida
Amy L. Morris, PharmD
Coach, ASCO Quality Training Program
Clinical Pharmacist, Leukemia/MDS
UVA Health
Charlottesville, VA
Please Provide Background about Yourself, your Team, and your Quality Improvement Project.
Dr. Louis-Jeune currently serves as the Pharmacy Safety and Quality Coordinator at Memorial Cancer Institute (MCI). Dr. Morris serves as faculty for the American Society of Clinical Oncology (ASCO) Quality Training Program (QTP), and coached this team on their Quality Improvement (QI) project. She is a Clinical Pharmacist at UVA Health.
During Fiscal Year 20220, MCI welcomed ~74,000 patient visits; increased volume was accompanied by treatment start delays. Due to cleanroom optimizations to meet USP 797 & 800 requirements, concern arose that pharmacy was potentially the rate limiting step in chemotherapy initiation. Our institutional initiative, therefore, was to improve patient wait times for chemotherapy, and our project focused specifically on decreasing time to chemotherapy initiation for patients admitted to the hospital.
Our core team consisted of two physicians, the Director of Pharmacy, and myself. Senior leadership buy-in and involvement was key. The VP of MCI at the time sponsored our teams’ training; he is an ASCO QTP faculty member. The MCI Director of Quality and a Clinical Pharmacist from UVA Health served as our team’s QTP coaches.
How was the Problem and Aim Statement Developed?
Although patient satisfaction scores indicated there were issues with “wait time,” our institution did not have benchmarks or detailed reports confirming and quantifying delays to initiating chemotherapy. We started this project assuming our focus would be on the outpatient infusion services. The team quickly learned we would be more successful selecting a small population and honing in on a specific issue, resulting in a shift of our focus to oncology patients treated in the inpatient setting, evaluating time to first chemotherapy. We could then adopt the findings and processes to a generalized population, i.e outpatient clinics.
We missed a major key factor that is necessary throughout any successful quality improvement project: Data! This was a lightbulb moment for me. This project would require our team to replace subjective theories with objective facts.
First, we needed to develop a problem statement which clearly defines what does not meet stakeholders’ needs. It must be objective (no blaming and shaming) and quantifiable, so our team had to gather data manually from the electronic medical record to quantify our actual wait times. We used the 5Ws – Who, What, Where, When, and Why to create our problem statement. Once we identified the average time to chemotherapy, we created a SMART (Specific, Measurable, Achievable, Relevant and Timely) aim statement to define the goal of our project. Originally we approximated a time reduction, however, utilizing externally published benchmark data helped to establish an achievable time reduction goal.
What were the Project’s Deliverables?
In addition to the problem statement, embedded in the aim was an overarching timeline that further guided time-specific targeted milestones. However, it was evident that each team member’s schedule varied on a day-to-day basis and patient care was top priority. Therefore, from the start of the project, we established a recurring meeting to meet our deliverables. The active involvement of our coaches kept the momentum during each meeting.
Our multidisciplinary team first mapped out the current state process, highlighting each operational step and decision point from patients’ arrival to the unit to time to first chemotherapy administration. Using sticky notes to jot down each process allowed us to rearrange the map easily as we worked. We had several learning opportunities during this process and decided to integrate additional frontline team members due to gaps in knowledge of inpatient workflows. We optimized our team through the involvement of the Advanced Practice Providers Supervisor and Nurse Manager of the inpatient oncology department.
What was the Process for Evaluating Data?
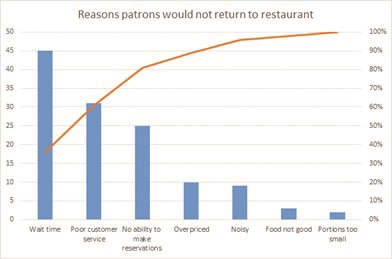
Our team used different QI tools to analyze data. We brainstormed potential causes of chemotherapy delay on a cause-and-effect diagram, also called a fishbone diagram. However, the tool that impacted our work the most was the Pareto chart, which truly told a story using the data! A Pareto chart prioritizes the most frequent causes and displays that 20% of causes contribute to 80% of the problem (see table 1).
The Pareto can be hard to imagine if you haven’t created one before, so below is a simple Pareto sample chart outlining the reasons for patrons not to return to a restaurant. If the restaurant owner did not gather data from his guests, but instead assumed his loss of revenue and empty restaurant was due to the chef and the quality of the food, he would be mistaken. Although this seems simplistic, often in healthcare the causes of system-wide problems are not fully analyzed and quantified, and efforts to fix the problem are less impactful if solutions do not focus on the highest contributors to the issue.
Our Pareto chart objectively highlighted and eliminated subjective assumptions about causes of delays. Data demonstrated pharmacy did not solely contribute to delays in chemotherapy administration. Quantifying causes for delay we recognized issues with lab collection and reporting were contributing the most to delays and set the groundwork for identifying process improvements that would make the most impact.

Improvements?
The next step was to implement our first intervention via a Plan, Do, Study, Act (PDSA) cycle. PDSA allows for planning and doing the intervention, but more importantly studying the outcomes and acting based on those measured outcomes. Some teams may meet their aim through the implementation of just one or two PDSA cycles, but it is important to remember that in QI, multiple PDSA cycles are usually needed to provide a robust outcome.
With the data provided from the Pareto chart and process map depicting the current workflow and all team members available, we brainstormed on different process and workflow optimizations that would aid in meeting our aim. To determine our first intervention, we utilized the priority matrix and assigned each recommendation to the appropriate quadrant depending on the amount of effort and ease of implementation. Implementing improvements that fall in the low effort and high impact quadrant lead the highest chance of success in meeting the aim statement. The first PDSA focused on the workflow for processing labs. Our physician team members served as the liaisons to the physician group; this step clearly demonstrated that physician group buy-in was successful through our team physician champion’s aide. We established a timeline to collect data that would provide meaningful information. At the end of PDSA #1, we recognized the benefit of the process improvement although we did not meet our aim. Therefore, we implemented PDSA #2 while continuing PDSA #1.
It was important for our team to understand that all QIs may not yield the expected outcomes or meet aim. However, we could always take what we learned to tailor future improvements. In conclusion, we reached our aim and determined sufficient data was available to move forward.
What was the Hardest Part of the Project?
I expected the hardest part of this project to reflect the beginning stages of the Kubler-Ross Change curve; as the project progresses from creating alignment, maximizing communication and sparking motivation, the team may face emotions such as shock, denial, frustration and depression. Very quickly, I realized that some things are out of our control. The COVID-19 pandemic threw a wrench in our timeline, and ultimately the entire QI project. Along with the nation, our department immediately focused its efforts to meet the national and organization’s guidelines to prevent the spread and provide relief to the shortage of healthcare workers. Our aim, timeline, and goals were altered. The number of admissions within our targeted patient population decreased. The momentum, that was once there, was shifted. Additional meetings with the coaches, including buy-in from leadership, were crucial to identify how to successfully regroup and refocus.
What Would you have done Differently?
I was so eager to make an impact and see this project through but didn’t realize QI does not end once data collection is complete. An effective QI requires continuous data evaluation to monitor shifts and trends. Through the manual data collection process, our team realized an important key member was missing; an information technology (IT) specialist, who should be involved in every QI. IT contribution may have saved time from all the manual data collection I performed throughout the improvement. In order to sustain the outcomes, I worked with IT to build a report providing the process time stamps identified. This learning point will contribute to future QI projects I lead or participate in.
What’s next?
Data, results, process optimizations and automation all play a role in the next key step in sustaining the improvement. Next, we will present the outcome and recommendations to the leadership team for buy-in and sponsorship to standardize the process throughout the oncology departments. Our team has taken the next steps to disseminate knowledge gained during the QTP project, and we will participate in and coach future QIs within our department.
For details of the QI project: https://meetings.asco.org/abstracts-presentations/201949
REFERENCE
- Vulfovich M, Salzberg M, Louis-Jeune M, et al. Decreasing inpatient chemotherapy initiation delays at Memorial Regional Hospital. J Clin Oncol. 2021:39 (suppl 28); abstr 225.
